
Heart Rate Variability (HRV) parameters
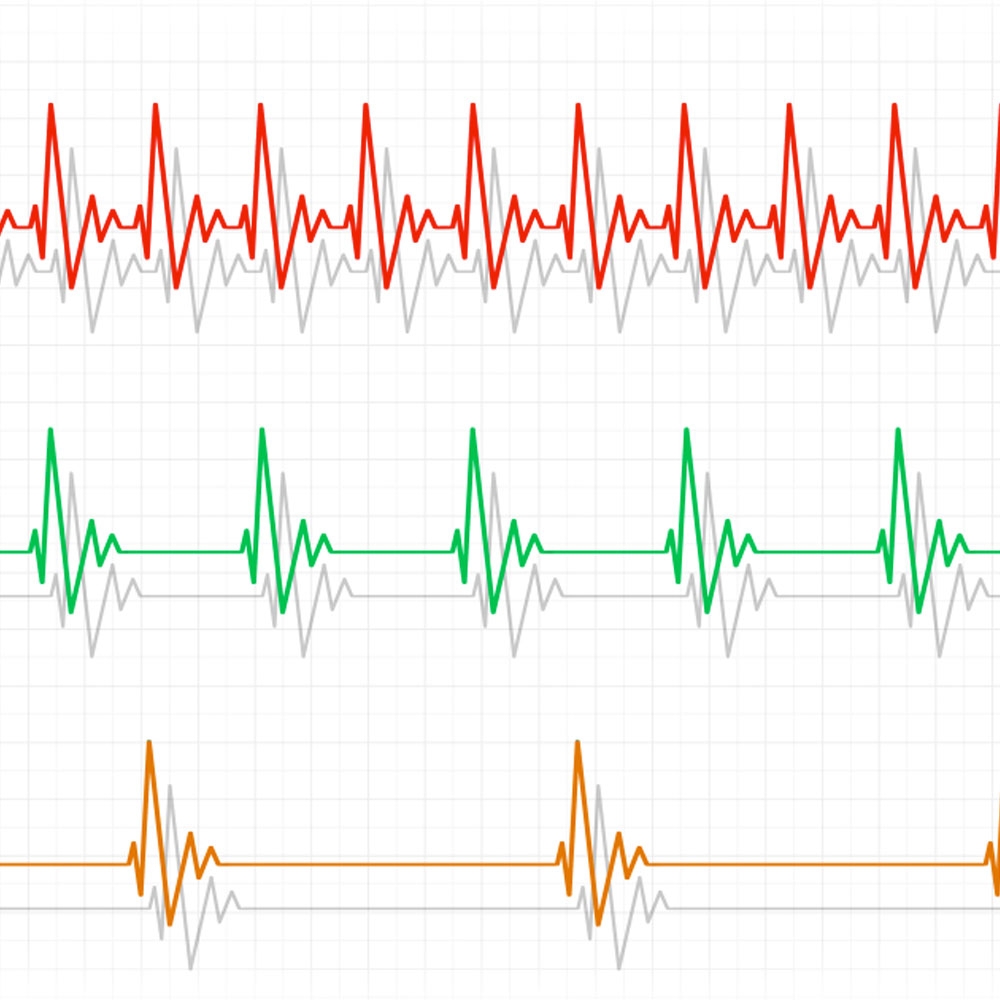
Heart rate variability is the fluctuation in time intervals between adjacent heartbeats. Our HRV parameters are derived from the ECG signal measured with the Finapres® NOVA, obtained in time- and frequency domain, and based on a 5-minutes interval. Subsequently, the HRV signals are updated every heartbeat. A filter is applied to detect and remove abnormal beats. The method to calculate the HRV parameters is based on the HRV Guidelines, published by the European Heart Journal [1].
Our AT application provides these parameters:
- VLF: the power in Very Low Frequency range
- LF & LFNorm: the (normalised) power in Low Frequency range
- HF & HFNorm: the (normalised) power in High Frequency range
- LF/HF ratio: the ratio between LF and HF
- RMSDD: the square root of the mean of the sum of the squares of differences between adjacent NN (Normal-to-Normal) intervals
- SDNN: standard deviation of all NN intervals
- pNN50: count of number of pairs of successive NNs that differ by more than 50 ms divided by the total number of all NN intervals
- HRVI: total number of all NN intervals divided by the height of the histogram of all NN intervals
- TP: The total Power
- Beat classification: indicates for each beat whether it is included or excluded for the use of HRV signals
- BRS: Baroreceptor Sensitivity
Baroreceptor sensitivity (xBRS)
The BRS parameter describes the amount of response in heartbeat interval to a change in blood pressure, expressed in ms/mmHg. The BRS parameter is obtained from the systolic blood pressure signal and derived using a well-validated cross-correlation method, which calculates the correlation between beat-to-beat blood pressure and delayed pulse intervals. The measurement of the baroreflex is a source of valuable information in the clinical management of cardiac disease patients, particularly in risk stratification [2]. More details on the calculation and validation are available in this scientific paper from Westerhof et al.[3].
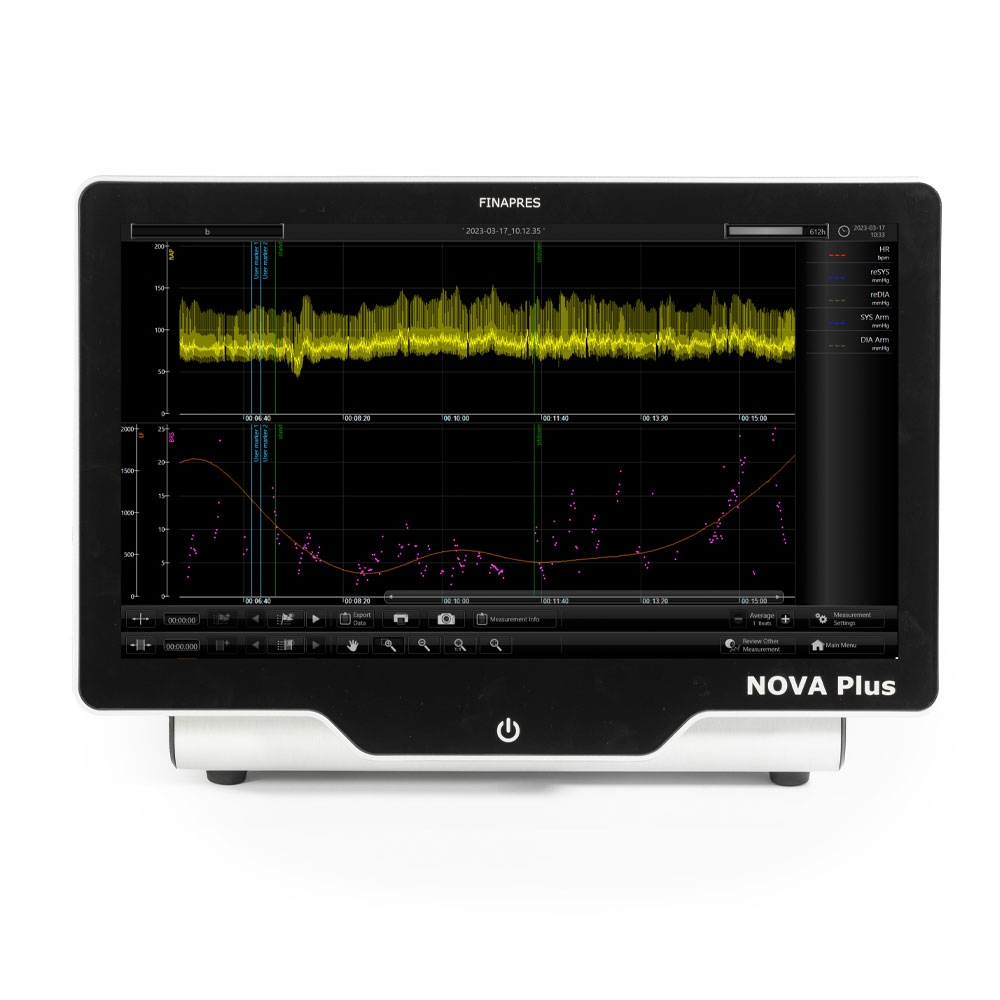
As an example of a potential application of the AT software, the image shows the immediate blood pressure (reBAP), heart rate, BRS response during a deep breathing test recorded with the Finapres® NOVA.
xBRS method benefits
Compared to other time-sequential methods (such as sBRS) [3,4]:
- xBRS provides more BRS values per unit of time
- xBRS determinations are more equally distributed over time
- 50% reduction of within-patient variance
- No thresholds for pressure and interval variation needed
Compared to spectral method [5]:
- Exact event location in time
- xBRS provides the distribution of BRS per time interval
- No manual editing needed: most artifacts are rejected in the software
References
- Camm, A. John, et al. “Heart rate variability: standards of measurement, physiological interpretation and clinical use. Task Force of the ESC and the NASPE.” (1996): 1043-1065.
- La Rovere, M.T., Pinna, G.D., & Raczak G. “Baroreflex sensitivity: measurement and clinical implications”. Annals of noninvasive electrocardiology: the official journal of the International Society for Holter and Noninvasive Electrocardiology, Inc, 13 (2), 191–207.
- Westerhof, Berend E., et al. “Time-domain cross-correlation baroreflex sensitivity: performance on the EUROBAVAR data set.” Journal of hypertension (2004): 1371-1380.
- Westerhof, Berend E., et al. “Time course analysis of baroreflex sensitivity during postural stress.” American Journal of Physiology-Heart and Circulatory Physiology (2006): H2864-H2874.
- Laude, Dominique, et al. “Comparison of various techniques used to estimate spontaneous baroreflex sensitivity (the EuroBaVar study).” American Journal of Physiology-Regulatory, Integrative and Comparative Physiology (2004): R226-R231.